Shrinking the Website and Still Fighting the Performance Scores
ஏப்ரல் 16, 2021
A practical optimization day: breakfast, more minimization, Lighthouse and WebPageTest confusion, GTmetrix and Dare Boost checks, image-format decisions, SLT delays, and the sinking realization that even after making the site smaller, the performance numbers still refuse to behave cleanly.
Comparing Raspberry, Strawberry and Mango Jam Brands
11:30 a.m.
My maid Manju made me breakfast:
Raspberry Jam sandwich toast and half boiled eggs.
The raspberry jam is horrible.
I will go back to Strawberry jam by MD.
I also need to try out and finish the mango jam by MD.
MD brand does a good job.
The Kist sherbet syrup is terrible compared to MD sherbet drink too.

Minimising the Website Without Losing Image Quality
4:15 p.m.
I am working. I will write later.
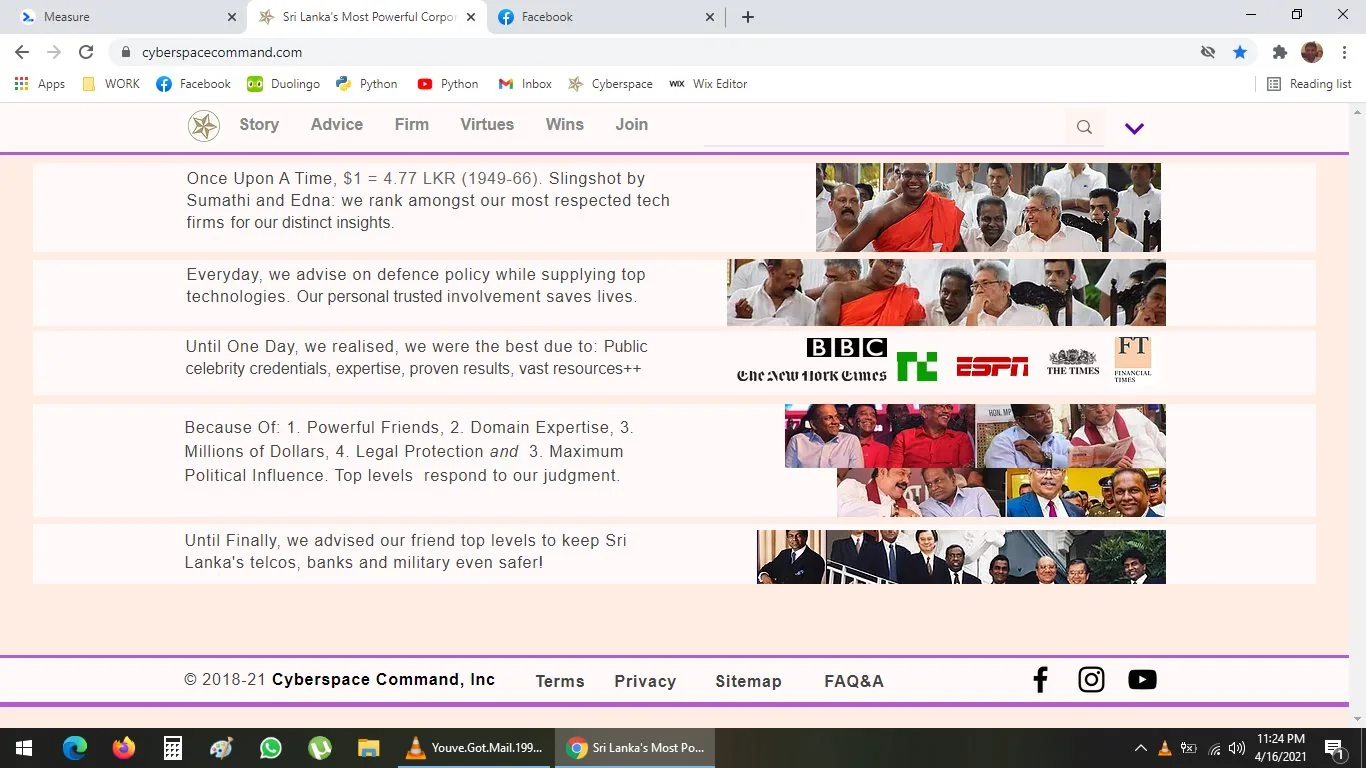
May need to minimise website further.
I worry I might end up losing picture quality, but I can add these to other sections of the website.
Average loading times are anyway 6 seconds for technology websites
Our firm is doing a fantastic job without a Content Delivery Service Provider or CDP as well !
Lighthouse Scores Falling Despite Website Optimisation
7:45 p.m.
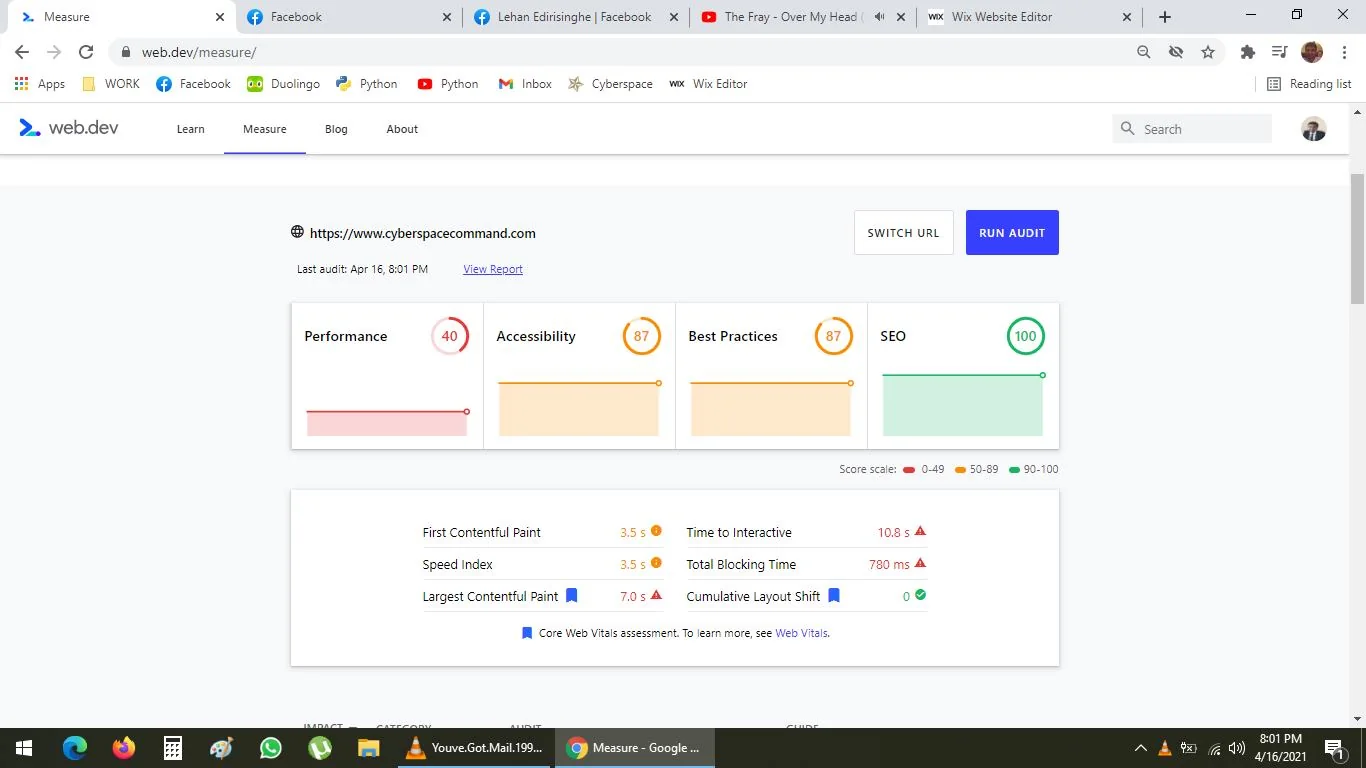
Very strangely, I found out that my efforts did not really result in improvements:
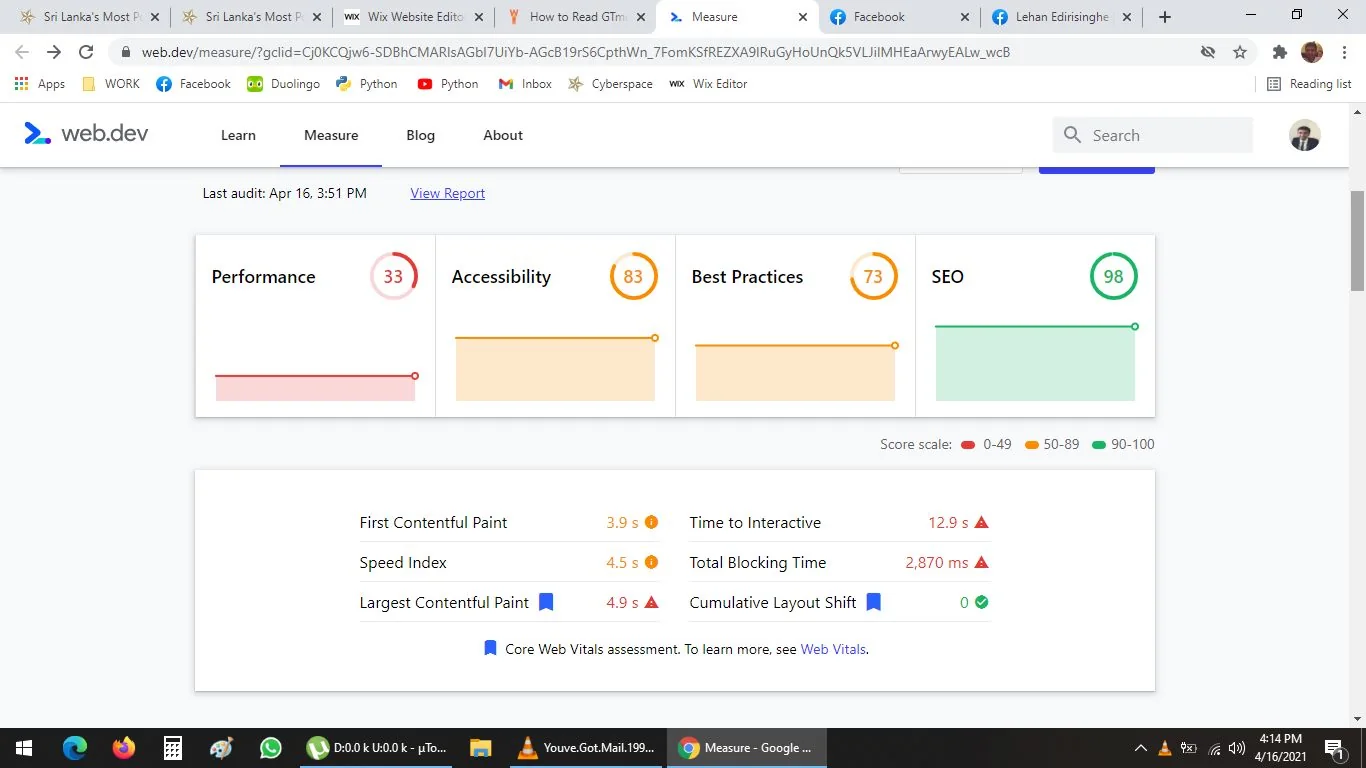
On Apr 16:
__
@ 3:50 PM
33
Performance
83
Accessibility
73
Best Practices
98
SEO
0–49
50–89
90–100
33
Performance
Metrics
First Contentful Paint
3.9 s
Speed Index
4.5 s
Largest Contentful Paint
4.9 s
Time to Interactive
12.9 s
Total Blocking Time
2,870 ms
Cumulative Layout Shift
0
___
@ 6:32 PM
21
Performance
82
Accessibility
73
Best Practices
99
SEO
0–49
50–89
90–100
21
Performance
Metrics
First Contentful Paint
3.8 s
Speed Index
18.6 s
Largest Contentful Paint
4.8 s
Time to Interactive
51.1 s
Total Blocking Time
43,420 ms
Cumulative Layout Shift
0
__
@ 7:17 PM
25
Performance
82
Accessibility
80
Best Practices
99
SEO
0–49
50–89
90–100
25
Performance
Metrics
First Contentful Paint
3.2 s
Speed Index
6.6 s
Largest Contentful Paint
9.5 s
Time to Interactive
11.2 s
Total Blocking Time
1,920 ms
Cumulative Layout Shift
0.014
__
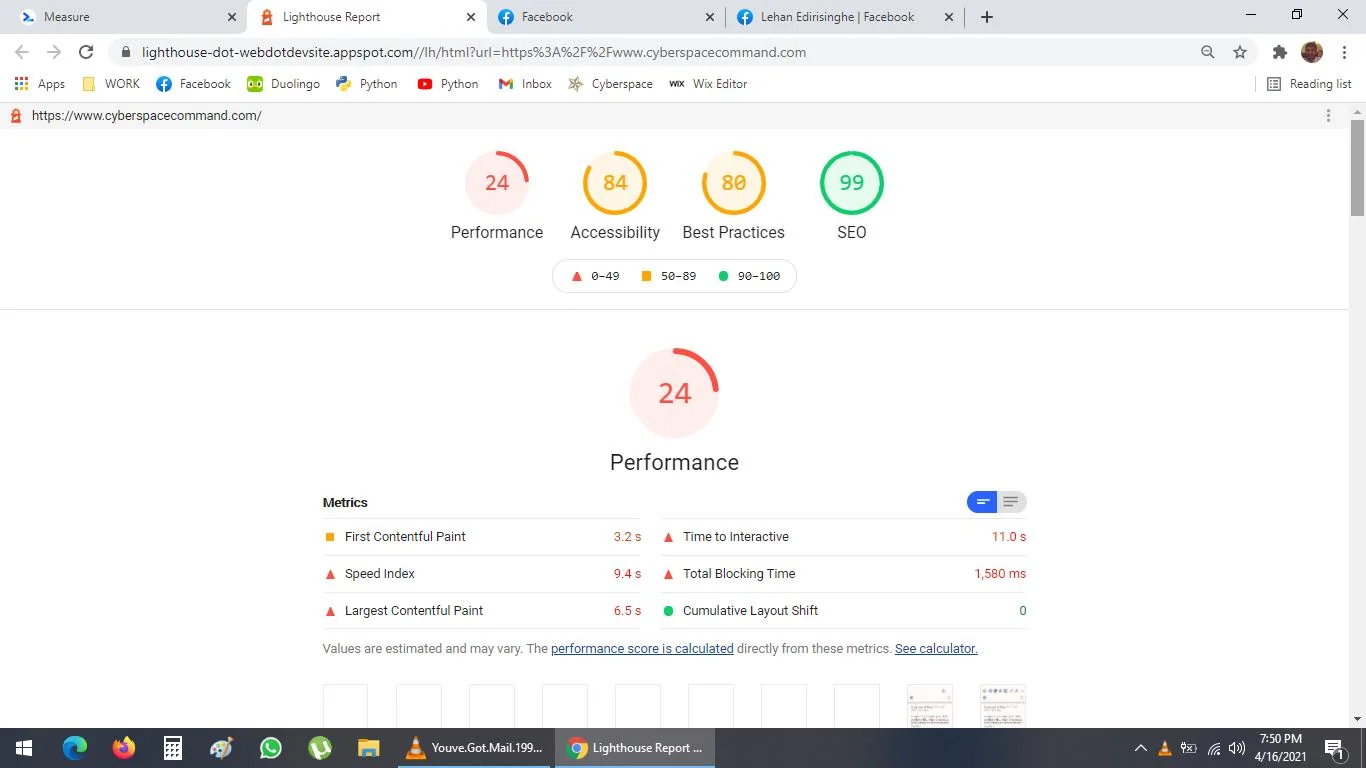
@ 7:30 PM
28
Performance
82
Accessibility
80
Best Practices
99
SEO
0–49
50–89
90–100
28
Performance
Metrics
First Contentful Paint
3.2 s
Speed Index
6.5 s
Largest Contentful Paint
6.8 s
Time to Interactive
11.1 s
Total Blocking Time
1,490 ms
Cumulative Layout Shift
0.014
___
Very, very strange.
So, performance plunged from initial 33 to 21, then up to 25 and then 28.
Crazy.
I mean, at 6:32 PM, I had already removed many elements, so it is very strange.
I dunno. Maybe, I have work to do or I need to use a CDN service or something--
Very, very strange, I am 'in over my head' as this is not my area of expertise, though I am learning.
I have a gut feeling, I have improved things because the homepage was minimalized.
***
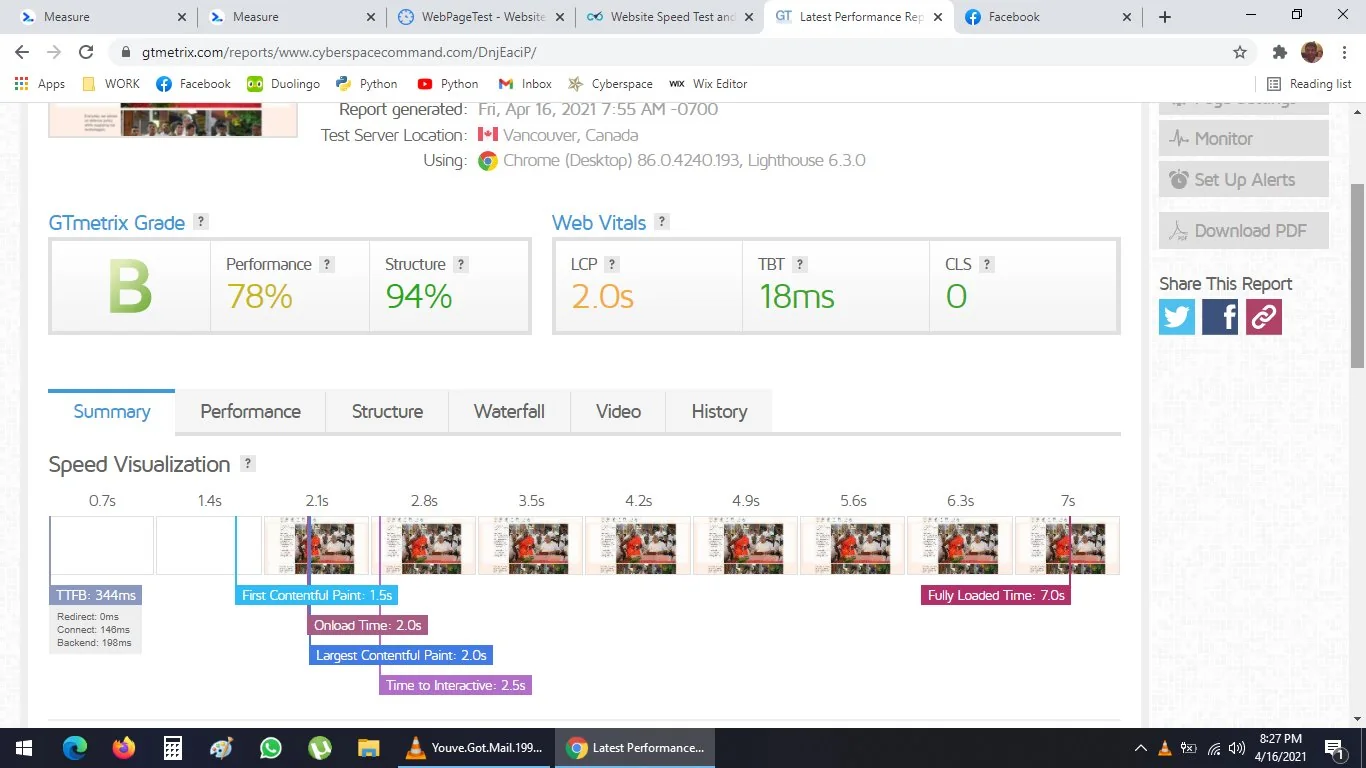
Here is a latest report screenshot