How American Cars Got So Bad? Wendover Gets Detroit's Biggest Sales Story Wrong
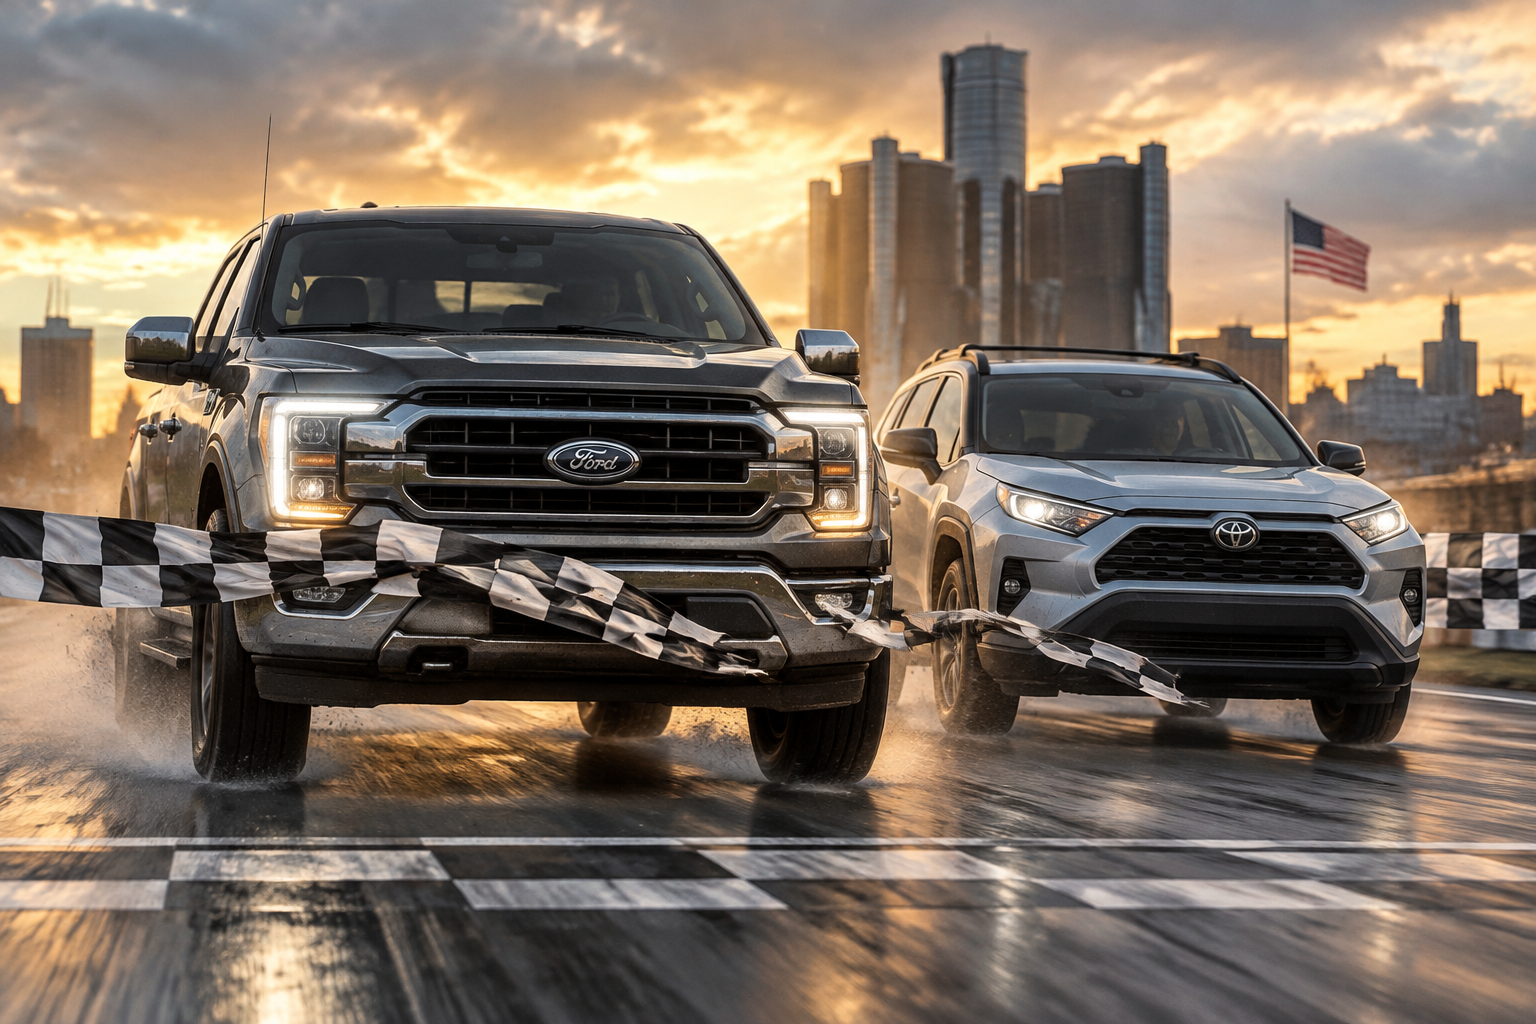
Wendover Productions builds its indictment of Detroit around a powerful idea: America's traditional automakers abandoned passenger cars, protected their profits through government policy, and allowed foreign competitors to take over. There is a serious story here. But the episode makes a remarkable factual error at precisely the moment it tries to demonstrate how far Detroit has fallen: Toyota's RAV4 did not dethrone Ford's F-150 as America's best-selling vehicle in 2024.
Ford's F-Series sold 765,649 vehicles in 2024, retaining its position as America's best-selling vehicle for the 43rd consecutive year. Toyota's RAV4 sold 475,193, placing third behind the F-Series and Chevrolet Silverado. This is not a disputed interpretation or a matter of classification. The episode's supposed turning point is contradicted by the manufacturers' sales figures and independent sales rankings.
Ford From the Road+2
That mistake matters because the RAV4 example is used to suggest that Detroit has lost even the market it spent decades protecting. Toyota is certainly a formidable competitor, but it did not take the crown Wendover awarded it. An argument about American industrial decline does not become stronger by inventing a defeat that never happened.
There is an important qualification: the RAV4 did outsell the individual F-150 model. JATO Dynamics' figures put the RAV4 at 475,193 and the F-150 at 460,915. But Ford's F-Series, which combines the F-150 with Super Duty models, sold 765,649. The distinction is between the best-selling individual nameplate and the best-selling truck family. Wendover's comparison is defensible when comparing individual models; its failure is not explaining the different counting methods.
Road & Track+1
That is a more useful criticism than pretending Toyota did not win the individual-model comparison. A journalist should be able to distinguish a genuine competitive setback from a misleading comparison.
The Chicken Tax is not an SUV subsidy
The episode combines two different regulatory systems and makes them sound like one loophole.
The 25% Chicken Tax applies to imported pickup trucks. A 2005 Congressional Research Service report specifically notes that an earlier US government ruling excluded imported SUVs from classification as pickup trucks for purposes of this tariff. The tariff helped protect domestic pickup manufacturing, but it does not establish that foreign SUV manufacturers had to build their SUVs in America to avoid the tax.
Every CRS Report+1
The CAFE argument is more substantial, but Wendover oversimplifies it. Passenger cars and light trucks have historically faced different fuel-economy requirements, creating a genuine financial incentive to manufacture vehicles qualifying as trucks.
However, not every SUV qualifies as a light truck. The regulatory test includes cargo-carrying characteristics and measurable off-road requirements. Under the off-road classification, a vehicle generally needs four-wheel drive or a gross vehicle weight rating above 6,000 pounds, together with at least four specified ground-clearance and approach-angle characteristics.
LII / Legal Information Institute+1
This is not merely a technical distinction. In its 2011 fuel-economy rule, NHTSA moved more than one million two-wheel-drive SUVs from the truck fleet into the passenger-car fleet. EPA's 2024 report likewise distinguishes between car SUVs and truck SUVs, noting that most two-wheel-drive SUVs below 6,000 pounds are classified as cars.
NHTSA+1
The regulatory advantage is real, but the episode turns a complicated system into a blanket exemption for SUVs. Worse, it uses the Chicken Tax to reinforce a claim about SUVs when the tariff's principal protection concerns imported pickups.
That is not a minor technical omission. It weakens the central explanation of why Detroit abandoned passenger cars.
Consumer demand is not simply manufactured by advertising
Wendover describes American demand for SUVs as artificial, arguing that manufacturers created the market through decades of advertising.
There is a problem with that conclusion: the episode does not establish how much of the shift resulted from marketing, how much came from consumer preferences, and how much came from the economics of manufacturing.
Ford's 2018 decision to abandon most of its North American passenger-car lineup was explicitly attributed to declining demand and product profitability. Contemporary Reuters reporting also documented American consumers moving toward larger, more comfortable SUVs and pickups.
CBS News+1
EPA's longer-term production data adds another important distinction: the shift has involved both truck-classified SUVs and car-classified SUVs. The latter do not receive the same light-truck CAFE treatment. Truck SUVs alone accounted for half of new vehicle production in model year 2024.
US EPA
Marketing undoubtedly helped normalize larger vehicles, and manufacturers had financial reasons to encourage that preference. But the episode offers no evidence measuring advertising's contribution against actual consumer demand.
It takes two facts — automakers advertise SUVs and SUVs are profitable — and treats them as proof that advertising created the market.
That is a theory, not an established finding.
The labor comparison confuses Japanese workers with American factories
The claim that Japanese automobile workers were not unionized is factually misleading.
Toyota's 2024 SEC filing states that approximately 88% of its regular employees in Japan belonged to the Federation of All Toyota Workers' Unions. Japan's Confederation of Automobile Workers' Unions reported 784,000 members across 12 federations in September 2025. Its unions are generally organized around individual companies rather than the American industrial-union model.
トヨタ自動車株式会社 公式企業サイト+1
There is an important distinction that the episode misses: Japanese-owned automobile factories operating in the United States were largely nonunion, as the Congressional Research Service documented in 2005. That created a different labor-cost structure from Detroit's heavily unionized manufacturing operations.
Every CRS Report
The Big Three's legacy healthcare and pension obligations were genuine competitive concerns. The same CRS report recorded their representatives claiming costs of up to $1,500 per vehicle for healthcare and pension benefits.
But comparing unionized American workers with supposedly nonunion Japanese workers is the wrong comparison. The relevant distinction is between American domestic manufacturing arrangements and foreign-owned American transplant factories.
Wendover also supplies an approximate 8% labor-cost figure without establishing a comparable breakdown of wages, benefits, productivity, and total manufacturing costs across the competing manufacturers.
A complicated industrial cost disadvantage deserves more than a convenient explanation about unions.
GM's engine scandal is real, but the numbers need precision
General Motors' L87 V8 engine failures are among the episode's strongest examples of poor quality control. The 2025 recall covered 597,630 vehicles, including Chevrolet Silverado, Tahoe and Suburban models, Cadillac Escalades, and GMC Sierra and Yukon vehicles. GM identified defects involving crankshaft dimensions, connecting rods, and engine bearings.
NHTSA+1
But the episode states that consumers had been registering complaints for six years. GM's own recall filing identifies 28,102 potentially related US field complaints or incidents received between April 29, 2021, and February 3, 2025 — less than four years.
There are further qualifications:
- Of the 28,102 complaints or incidents, 14,332 involved allegations of loss of propulsion.
- GM identified 12 alleged crashes and 12 alleged injuries. The reported injuries were minor or non-physical, and most were not crash-related.
- The 42 potentially related fire reports were allegations; GM said causation was unclear in most cases.
- GM estimated that approximately 3% of the 597,630 vehicles in the recall population had the defect.
These details come from GM's formal recall submission to NHTSA. They do not make the engine failures harmless; they establish what was actually documented and what remained uncertain.
NHTSA+1
The episode is right to scrutinize GM's three earlier investigations, closed in 2022, 2023 and 2024, before reopening its investigation in January 2025 following notification of NHTSA's investigation.
But an investigative video should not stretch a documented complaint period by more than two years or present allegations as established incidents.
Recall counts are not reliability ratings
The episode identifies Chrysler, Ford and GM as having the first, second and fourth highest numbers of recalls in 2024.
The underlying ranking is broadly supported by NHTSA data. But the number of recall campaigns is not the same thing as the number of defective vehicles or a manufacturer's failure rate.
Consider the 2024 figures compiled from NHTSA records:
- Stellantis: 72 recall campaigns.
- Ford: 67.
- General Motors: 34.
- Tesla: 15 campaigns, affecting more than 5.1 million vehicles.
Tesla's recall total was the largest by affected vehicles, despite having far fewer campaigns. Stellantis affected approximately 4.8 million vehicles, while Ford affected approximately 4.77 million.
Motor1.com
A recall involving one vehicle and a recall involving two million vehicles each count as one campaign. The count also does not distinguish between minor labeling problems, software updates and catastrophic mechanical failures.
The Consumer Reports reliability rankings provide a more useful independent measure. Its 2025 survey collected information on more than 300,000 vehicles and assessed 20 potential trouble areas, weighting problems according to severity.
Buick ranked 11th, Ford 13th, Chevrolet 16th, Jeep 19th, GMC 20th and Cadillac 21st. No Detroit Big Three brand entered the top ten. This supports the episode's criticism of American manufacturers' reliability, although it remains a survey-based prediction rather than proof that every model is unreliable.
Cars.com
The distinction matters. A serious argument about declining quality should use measurements that actually establish declining quality, not simply count how many times manufacturers file recall paperwork.
Stellantis: the 2023 profit story did not last
The Stellantis example is compelling, but the episode presents a snapshot as though it describes an enduring business strategy.
The company's 2023 financial results were impressive:
- Net profit: €18.6 billion.
- Cash returned to shareholders: €6.6 billion through dividends and share buybacks.
- CEO Carlos Tavares's total reported remuneration: €36.49 million, of which 93% was variable compensation.
The episode's dollar conversions are broadly understandable, but the shareholder figure combines dividends and buybacks, while the CEO figure represents total remuneration rather than simply a cash salary.
Stellantis+1
The subsequent results tell a different story.
Stellantis reported €5.5 billion in net profit for 2024, a 70% decline. In February 2026, it reported a €22.3 billion net loss for 2025, driven by €25.4 billion in unusual charges. Its adjusted operating loss was €842 million.
Stellantis+1
CEO Antonio Filosa described the company's mistake as overestimating the pace of the electric-vehicle transition and failing to align products sufficiently with customers' actual preferences. Stellantis subsequently reset its product strategy, expanded internal-combustion and hybrid options, and suspended its 2026 dividend.
Stellantis+1
This is important new evidence.
Detroit's problems cannot be reduced to executives preferring profitable SUVs over innovation. Stellantis also misjudged the pace of electrification, product demand and its own operational capabilities.
The company that appeared to have perfected the high-margin strategy in 2023 was facing a massive financial and strategic reset two years later.
That is a more complicated failure than the episode's explanation allows.
Closing verdict
Wendover identifies genuine problems: Detroit's retreat from passenger cars, regulatory advantages for truck-classified vehicles, attractive SUV margins, declining reliability and the financial consequences of poor manufacturing decisions.
But it turns those observations into an overly convenient explanation.
It conflates the Chicken Tax with CAFE regulations, treats SUVs as though they all receive the same regulatory advantages, understates genuine consumer demand, misrepresents Japanese labor arrangements, and fails to distinguish recall campaigns from actual failure rates. Its GM example also loses important qualifications that materially change the interpretation of the evidence.
The subsequent Stellantis results demonstrate another missing dimension: the consequences of misjudging electrification and customer demand.
My objection is not that Detroit deserves defending. It doesn't. My objection is that an explanation of industrial decline must be more accurate than the industry it criticizes.
America's automobile manufacturers have made consequential mistakes. They deserve rigorous scrutiny, particularly when customers, workers and shareholders bear the costs. But the strongest case against them does not need inflated statistics, confused regulations or convenient assumptions.
Wendover has a worthwhile subject. Its explanation does not yet meet the standard its subject deserves.
References
1. How American Cars Got So Bad — Wendover Productions, original video. Watch the episode. The original argument and claims examined in this critique.
2. From Disco to Crypto: Ford F-Series Trucks Outlast Every Trend — Ford, December 30, 2024. Read the announcement. Establishes the F-Series' continued overall sales leadership.
3. Ford F-150 Came in Second to Toyota RAV4 in 2024 U.S. Registrations — Road & Track, 2025. Read the analysis. Provides the individual-model comparison and explains the distinction between the F-150 and the broader F-Series.
4. U.S. Automotive Industry: Recent History and Issues — Congressional Research Service, April 25, 2005. Read the report. Documents the Chicken Tax's pickup-truck focus, SUV tariff classification and differences between unionized domestic factories and foreign-owned US transplant facilities.
5. Average Fuel Economy Standards: Passenger Cars and Light Trucks, Model Year 2011 — NHTSA, 2009. Read the rule. Documents the reclassification of more than one million two-wheel-drive SUVs into the passenger-car fleet.
6. Highlights of the Automotive Trends Report — US Environmental Protection Agency. Read the report. Distinguishes car SUVs from truck SUVs and documents the continuing shift in American vehicle production.
7. Toyota Motor Corporation, Form 20-F — Toyota, filed June 25, 2024. Read the filing. Establishes that approximately 88% of Toyota's regular employees in Japan belonged to its workers' union.
8. Confederation of Japan Automobile Workers' Unions — 2025 Brochure — JAW, September 2025. Read the brochure. Documents the 784,000-member organization and Japan's enterprise-based automotive union structure.
9. Part 573 Report N252494000: L87 Engine Loss of Propulsion — General Motors, filed with NHTSA April 24, 2025. Read the recall filing. Provides the actual complaint period, reported incidents, alleged injuries, fires and estimated recall defect rate.
10. Tesla Recalled the Most Cars in 2024 — Motor1, December 31, 2024. Read the analysis. Separates recall campaign counts from the number of vehicles affected.
11. Subaru Tops Consumer Reports Annual Auto Reliability Survey — Cars.com, December 6, 2024. Read the report. Provides Consumer Reports' survey methodology and manufacturer reliability rankings.
12. Full Year 2023 Results — Stellantis, February 15, 2024. Read the financial results. Establishes the €18.6 billion profit and €6.6 billion returned to shareholders.
13. Stellantis 2023 Annual Report — Stellantis, February 2024. Read the annual report. Provides the detailed breakdown of Carlos Tavares's reported remuneration.
14. Full Year 2025 Results — Stellantis, February 26, 2026. Read the financial results. Documents the €22.3 billion net loss, unusual charges and strategic reset.
15. Ford to Shed Most of Its North American Car Lineup — Associated Press, April 26, 2018. Read the report. Records Ford's stated reasons for abandoning most passenger cars: declining demand and profitability.