The Mississippi Is a Freight Bargain. Wendover Still Gets the Math Wrong.
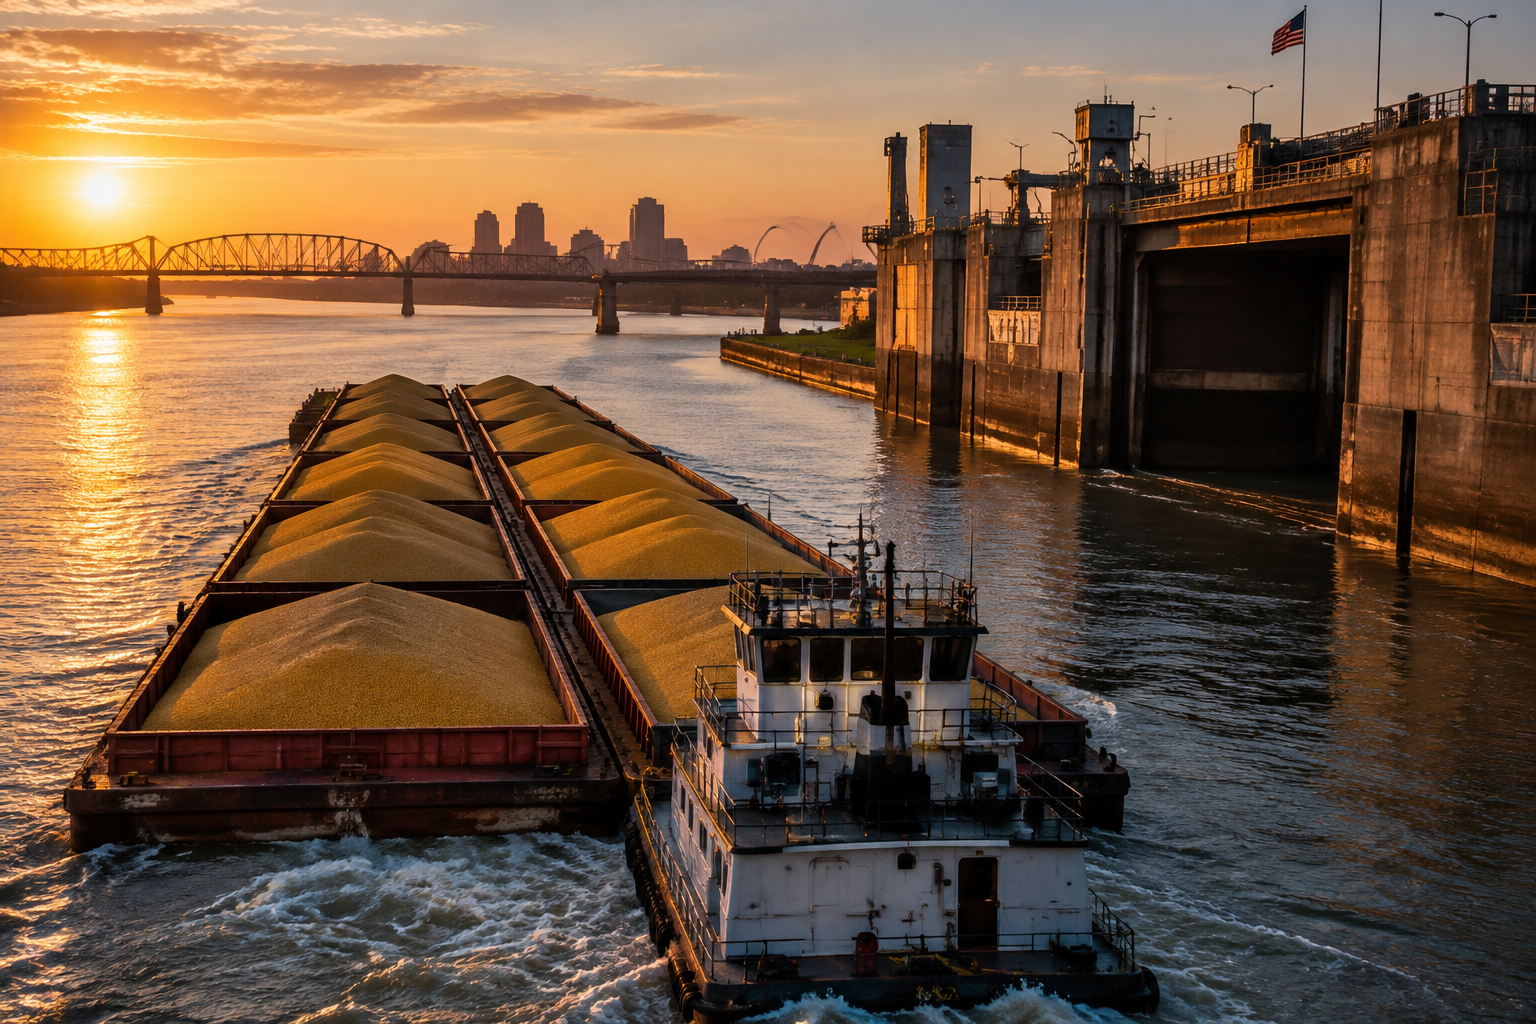
The Mississippi River is an extraordinary economic asset. Barges really are more fuel-efficient than trucks and trains, and America's inland waterways give agricultural producers access to international markets that would otherwise be considerably more expensive.
But Wendover Productions' How Inland Waterways Work makes a serious editorial mistake: it uses numbers that do not consistently support the conclusions built around them. An old transportation-cost comparison becomes a general economic fact. A flood-related estimate becomes the supposed cost of a lock failure. Brazil is portrayed as a static transportation disadvantage despite evidence of rapidly developing competing routes.
The taxpayer-subsidy argument is particularly revealing. The subsidy is real. Its justification, however, requires considerably more analysis than the video provides.
1. The transportation-cost figures are outdated and incorrectly presented
The video gives three figures:
- Truck: $5.35 per ton-mile.
- Rail: $2.53 per ton-mile.
- Barge: 97 cents per ton-mile.
There is a fundamental problem with these numbers. The exact 5.35, 2.53 and 0.97 figures appear in a Transportation Research Board comparison published in 2002. Its table explicitly labels the measurements cents per ton-mile, not dollars.
The original figures are therefore 5.35 cents for trucks, 2.53 cents for rail and 0.97 cents for barges. As presented in the supplied transcript, the narration mixes dollar and cent denominations, creating a potential 100-fold error in the absolute costs.
CiteSeerX+1
The age of the comparison is equally important.
A 2017 report hosted by the US Maritime Administration reviewed several transportation-cost studies. It found typical barge estimates of 1–2 cents per ton-mile, rail estimates of 2.5–3 cents, and truck estimates ranging from 5.4 to 42.3 cents.
More importantly, the report explicitly warns that transportation costs vary substantially by commodity and region. One 2013 grain-transport study even found that the lower end of its rail-cost estimate was below the upper end of its barge-cost estimate.
maritime.dot.gov+1
That is not a universal price comparison. It is a collection of estimates from different markets.
A shipper moving grain from Iowa to Louisiana does not face the same economics as a company moving chemicals between industrial facilities. Distance, loading, handling, transfers, equipment availability and return journeys all matter.
The video takes a genuine transportation advantage and presents it with more numerical certainty than its underlying evidence warrants.
The fuel-efficiency figures also need updating
The video quotes 647 miles per gallon per ton for barges, 477 for rail and 145 for trucks.
Those figures come from a 2017 Texas A&M Transportation Institute study using data through 2014.
A subsequent study, published in January 2022 and using 2019 data, reported:
Transportation mode 2014 figures used in video Updated 2019 figures Barge 647 675 Rail 477 472 Truck 145 151The updated research actually strengthens the barge's fuel-efficiency advantage. The original conclusion survives, but the video relies on figures that had already been superseded.
Waterways Council+1
There is also a relevant sponsorship relationship. The 2017 and 2022 modal-comparison research was commissioned by the National Waterways Foundation, whose stated mission includes developing arguments for an efficient, well-funded inland-waterway system.
Texas A&M conducted the research; the sponsorship does not invalidate its findings. But the funding relationship is relevant when research commissioned by an organization with an explicit policy objective is used to support a broad economic argument.
nationalwaterwaysfoundation.org
National Waterways Foundation+1
2. Brazil is becoming a more serious competitor than the video suggests
The episode's soybean comparison is one of its strongest narrative devices.
American farmers, despite substantially higher production costs, can compete with Brazil because they can transport their crops cheaply through the Mississippi system.
The video argues that Brazilian transportation costs to China are frequently much higher, sometimes approaching twice the American equivalent.
There is historical substance to this argument. Brazil has traditionally depended heavily on expensive truck transportation from inland producing regions to southern export ports.
But the comparison is changing.
The USDA's September 2025 Soybean Transportation Guide: Brazil 2024 provides actual route-specific transportation costs to Shanghai.
Route 2024 transportation cost per metric ton Iowa via US Gulf $108.74 Sorriso, Brazil, via Santos by rail $109.70 Sorriso, Brazil, via Barcarena by barge $101.88 Northwest Rio Grande do Sul via Rio Grande $63.05The first Brazilian route was only 97 cents more expensive than the Iowa route. The second was $6.86 cheaper, while the third was $45.69 cheaper.
Agricultural Marketing Service+1
These are different origins and transportation routes, so they do not establish that Brazil is universally cheaper. They establish something more important: the American transportation advantage is not universal or permanent.
Brazil is building competing waterways
Consider the Port of Barcarena.
In 2014, it exported approximately one million metric tons of soybeans. By 2024, that figure had reached 9.8 million metric tons.
A route from Sorriso in Mato Grosso to Barcarena combines approximately 600 miles of trucking with another 600 nautical miles of barge transportation.
Agricultural Marketing Service+1
This is precisely the kind of infrastructure development that challenges the video's static portrayal of Brazil.
USDA reported that, for the first time, transportation costs from Mato Grosso to China via Barcarena undercut those from Iowa via the US Gulf.
The video is entitled to argue that America's extensive waterway system gives it a historical competitive advantage. It is not entitled to treat that advantage as an unchanging feature of international trade.
The missing question is how quickly Brazil's expanding transport network could erode the advantage that American farmers currently enjoy.
3. The $300 million daily closure figure is attached to the wrong event
One of the episode's most consequential claims is that every day the Mississippi closes because of lock failure can cost the American economy approximately $300 million.
The closest identifiable source for this figure is a May 2011 CBS News report.
It quoted Gary LaGrange, then CEO of the Port of New Orleans, estimating that a complete Mississippi River shutdown could cost the American economy $295 million per day.
But the circumstances matter.
The report concerned the possibility of a shutdown caused by extreme flooding and dangerous river levels. The Coast Guard was considering restricting or stopping navigation to protect vessels and flood-control infrastructure.
It was not an estimate of the economic cost of an individual lock failure. Nor did CBS provide an independent economic model establishing the $295 million figure. It reported the estimate as a statement by the port's chief executive.
CBS News+1
Those are materially different scenarios.
A complete shutdown of the Mississippi and its associated port operations can disrupt enormous volumes of cargo, shipping schedules and industrial supply chains. A failure at one lock creates a different set of consequences, depending on its location, duration, available alternatives and the cargo affected.
The economic consequences of a lock failure can certainly be severe. But the $295 million estimate does not establish the daily cost of that event.
The distinction matters because the video uses a dramatic national economic figure to strengthen its argument about deteriorating lock infrastructure without establishing that the figure measures the problem being discussed.
4. The taxpayer subsidy is real. The economic accounting is unfinished.
The video makes a legitimate point about public spending.
A 2015 National Academies review estimated that federal general revenues covered approximately 90% of inland-waterway system costs.
For comparison, its historical estimates put the federal share of highway costs at approximately 25%, with railways and pipelines receiving virtually no comparable federal infrastructure support.
That is a substantial difference. Inland waterways receive unusually high levels of direct federal financial support.
National Academies+1
But the same National Academies report contains an important qualification: no authoritative study had estimated direct and indirect subsidies across all freight transportation modes.
Highways, railways and waterways have different funding arrangements. Highway infrastructure is shared with passenger traffic, state governments carry substantial maintenance responsibilities, and general-fund transfers have also supported highway and aviation trust funds.
The video identifies the waterway subsidy but does not complete the comparative accounting.
National Academies+1
What does the taxpayer actually receive?
The appropriate question is not simply how much the federal government spends.
It is what the country would lose if that transportation capacity disappeared.
The Army Corps of Engineers' Institute for Water Resources estimates that inland navigation generated $13.70 billion in transportation savings during 2023.
Its methodology compares actual waterway transportation rates with the estimated cost of the most likely least-cost alternative transportation mode for the same commodities.
This is a modeled economic benefit, not a net financial return to the Treasury. But it is precisely the kind of comparison needed to evaluate whether public investment is worthwhile.
iwr.usace.army.mil
USDA's 2026 analysis offers another useful example.
It examined a shipment of 22,500 tons of soybeans from Davenport, Iowa, to New Orleans.
Measure Barge Rail Transport cost $852,258 $911,411 Network distance 1,305 miles 930 miles CO₂ emissions 401,666 kg 409,524 kgMoving the cargo by rail would cost approximately $59,153 more.
But the USDA analysis also makes an important qualification: it assumes that rail capacity remains available and rates remain unchanged. A substantial diversion of waterway freight would put additional pressure on rail capacity and increase costs.
That is the real economic issue. The Mississippi is not simply competing against a cheaper or more expensive railway. It provides transportation capacity that alternative systems may struggle to replace.
Agricultural Marketing Service
The video does acknowledge the river's importance to domestic food supplies and industrial raw materials. What it does not do is calculate the distribution of benefits against the public cost.
How much goes to farmers? How much goes to exporters, manufacturers, workers and consumers? How much is saved through reduced pressure on other transportation networks?
Without that accounting, describing the system as a subsidy that benefits a few industries is an incomplete judgment.
5. The $732 million Lock 25 figure is not the full project cost
The episode discusses the construction of a new 1,200-foot lock at Lock 25.
It reports that the project received $732 million through the Biden administration's infrastructure legislation.
That funding figure is correct. But it is not the complete funding requirement.
The Army Corps of Engineers' project documentation states that the project requires another $1.531 billion to be fully funded, in addition to the original $732 million.
That puts the total funding requirement at approximately $2.263 billion.
mvr.usace.army.mil+1
The video uses the $732 million allocation when discussing the enormous potential cost of upgrading the entire Upper Mississippi system.
It does not explain that the first major replacement project already requires more than three times its initial allocation to reach full funding.
Its comparison with NASA's annual budget is therefore an illustration, not a properly established estimate of the cost of modernizing the entire system.
When infrastructure projects take decades and require billions in additional funding, the distinction between money allocated and money actually required is hardly a minor accounting detail.
Verdict: A strong economic case weakened by loose evidence
The Mississippi River remains one of America's most valuable freight transportation assets. Its fuel efficiency is real, its agricultural importance is substantial, and its aging infrastructure deserves serious attention.
I do not dispute those conclusions.
What I dispute is the way the video establishes them.
A 2002 transportation-cost table is not a current national average. A 2011 flood-related shutdown estimate is not a lock-failure cost. Brazil's expanding export infrastructure cannot be ignored when assessing America's competitive advantage. And identifying a taxpayer subsidy does not establish whether that subsidy is economically justified.
The most important unanswered question is whether America is receiving sufficient economic and strategic value from its investment in inland waterways, and whether alternative transportation systems could realistically replace that capacity.
That is the investigation the subject deserves.
Wendover has explained why the Mississippi matters. It has not adequately established the economics behind some of its strongest claims. The river's case is strong enough to survive scrutiny. The video's arithmetic should have to survive it, too.
References
1. Original work: How Inland Waterways Work — Wendover Productions — The original episode and the claims examined in this critique.
2. Transportation Research Board — Comparison of Inland Waterways and Surface Freight Modes, TR News 221 (July–August 2002). Read the original comparison. Establishes that the 0.97, 2.53 and 5.35 figures are cents per ton-mile.
3. US Maritime Administration / PwC — Economic Contribution of the US Tugboat, Towboat, and Barge Industry (May 2017). Read the report. Compiles competing transportation-cost estimates and documents their variation across commodities and regions.
4. Texas A&M Transportation Institute — A Modal Comparison of Domestic Freight Transportation Effects on the General Public: 2001–2019 (January 2022). Read the updated study. Provides updated fuel-efficiency figures using 2019 data and identifies its commissioning relationship with the National Waterways Foundation.
5. National Waterways Foundation — Our Mission. Read the foundation's mission. Establishes the foundation's stated policy objective of developing arguments for a well-funded inland-waterway system.
6. USDA Agricultural Marketing Service — Soybean Transportation Guide: Brazil 2024 (September 2025). Read the USDA guide. Supplies route-specific comparisons between American and Brazilian soybean transportation costs, including the expanding Barcarena corridor.
7. CBS News — Miss. River closing would cost U.S. $300m per day (May 14, 2011). Read the original reporting. Traces the $295 million estimate to a possible flood-related Mississippi shutdown and identifies its original speaker.
8. National Academies of Sciences, Engineering, and Medicine — Funding and Managing the U.S. Inland Waterways System (2015). Read Chapter 3. Documents federal funding shares and explains why cross-modal subsidy comparisons remain methodologically difficult.
9. US Army Corps of Engineers, Institute for Water Resources — Navigation: Value to the Nation. Read the economic-benefit calculations. Explains the methodology behind the $13.70 billion estimated transportation savings in 2023.
10. USDA Agricultural Marketing Service — Economic Importance of Inland Waterways to U.S. Agriculture (2026). Read the executive summary. Provides economic contribution estimates and a route-level comparison of barge and rail transportation.
11. US Army Corps of Engineers — Lock and Dam 25 New 1,200-foot Lock. Read the project documentation. Establishes the $732 million funding allocation and the additional construction funding requirement.