The Strait of Hormuz Was Never an 8% Problem: How a Misleading Oil Statistic Understates the Crisis
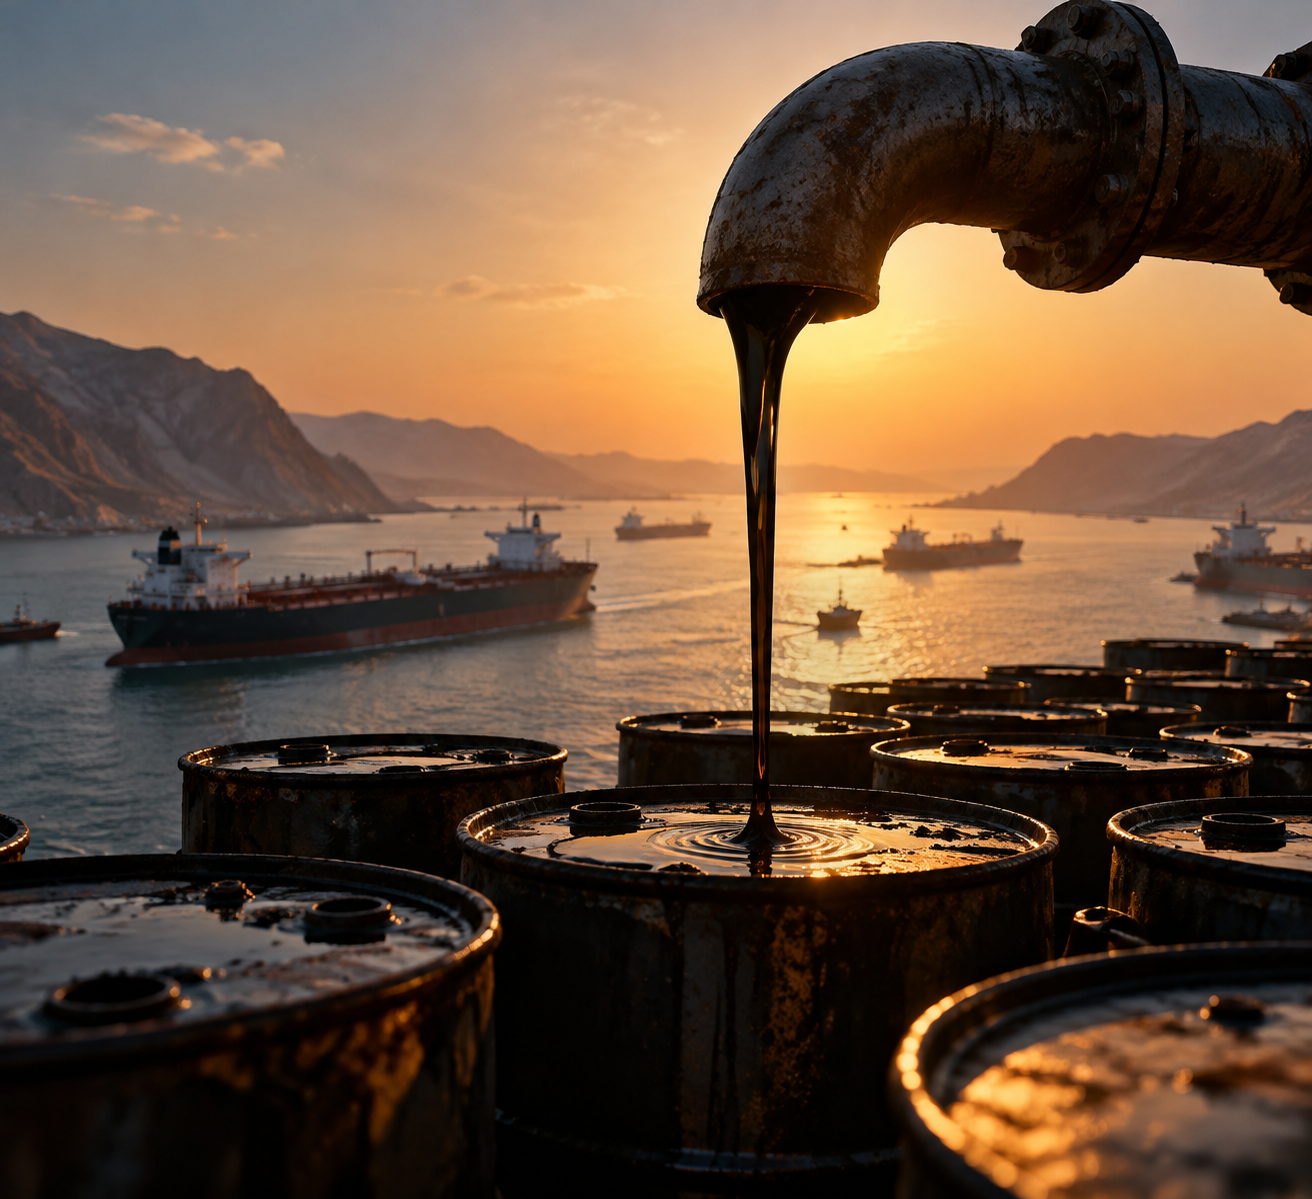
Wendover Productions makes a persuasive argument: Iran disrupted the world's most important oil shipping chokepoint, yet global oil production fell by only about 8%, suggesting that alternative pipelines and the resilience of international markets softened the blow.
The problem is that this comparison confuses three different things: oil normally shipped through Hormuz, oil production lost during the war, and oil actually available to international buyers.
Those are not interchangeable measurements. And when the International Energy Agency (IEA) published its subsequent accounting, the picture was considerably worse than the video's reassuring framing.
The IEA's April 14 report estimated that global oil supply fell by 10.1 million barrels per day in March, reaching 97 million barrels per day. That is a reduction of approximately 9.4%, not 8%. More importantly, the agency described the disruption as the largest in the history of the global oil market. It also reported that global observed oil inventories fell by 85 million barrels during March. IEA, Oil Market Report, April 2026.
The distinction matters. A country can continue producing oil, store it temporarily, or redirect some exports through another route. None of those actions guarantees that the oil reaches a refinery or buyer. Production statistics can therefore make a disrupted market look healthier than the actual supply available to consumers.
The 8% figure was a forecast that had already been revised
There is an important distinction in the reporting chronology.
On March 12, the IEA projected that global oil supply would fall by 8 million barrels per day during March. That was an estimate made while the disruption was unfolding, not the final measurement. On April 14, the agency revised its assessment: March supply had actually fallen by 10.1 million barrels per day, reaching 97 million barrels daily.
IEA+1
Wendover published its video on April 17. The updated IEA report had therefore been available for three days. Yet the video continued presenting the approximately 8% figure as what had actually happened.
YouTube+1
The difference is not enormous in percentage terms, but it matters when the entire argument rests on portraying the disruption as unexpectedly small.
There is a second problem with the comparison. The IEA records approximately 20 million barrels daily passing through Hormuz in 2025, comprising nearly 15 million barrels of crude and 5 million barrels of refined products. That represents approximately 25% of global seaborne oil trade, not a measurement of global production lost.
IEA
Wendover places the 20-million-barrel transit figure beside an 8% production contraction and treats the difference as evidence of market resilience. But oil produced and oil delivered are different things. A barrel sitting in a Gulf storage tank cannot supply a refinery in India simply because it still exists.
The IEA's April accounting makes the distinction concrete. By early April, Hormuz shipments had fallen to approximately 3.8 million barrels daily, from more than 20 million before the war; alternative export routes had increased to 7.2 million barrels from less than 4 million, yet total oil export losses still exceeded 13 million barrels daily.
IEA
That is not a minor shipping inconvenience. It is a substantial loss of oil reaching international buyers.
Four pipelines do not make four equivalent escape routes
Wendover's geographical explanation is useful, but its presentation gives the alternative infrastructure more weight than its actual operating capacity justifies.
The IEA's February 2026 assessment identified only Saudi Arabia and the UAE as having operational crude-oil pipelines capable of bypassing Hormuz. Their combined available spare capacity was estimated at 3.5–5.5 million barrels daily. The agency also warned that the logistics required to redirect and export substantial additional volumes had not been thoroughly tested.
IEA
The other two routes were considerably less dependable.
Saudi Arabia's pipeline was essential, but it was not operating in isolation. Aramco CEO Amin Nasser said on March 10 that the East–West Pipeline would reach its full 7-million-barrel daily capacity within days. He also disclosed that Aramco was using inventories stored in Asia, the Mediterranean and Northwest Europe to meet most customer requirements. He cautioned that those inventories would be adequate only if the war did not continue long term.
S&P Global
That qualification changes the story. Saudi Arabia was not simply replacing Hormuz with a pipeline. It was combining maximum pipeline throughput with geographically distributed oil inventories.
Iraq's 600,000-barrel figure was potential capacity, not actual replacement supply. Reuters reported that pumping through the Kirkuk–Ceyhan route began at 170,000 barrels daily on March 17, with a target of 250,000. The 600,000-barrel figure discussed in the video was a possible future level, not the volume immediately reaching international buyers.
Reuters
Iran's Jask terminal also illustrates the difference between infrastructure capacity and actual exports. The IEA had previously classified the terminal as effectively nonoperational, despite its nominal 1-million-barrel pipeline capacity. Subsequent satellite and shipping data examined by S&P Global estimated March 2026 exports through Jask at just 64,600 barrels daily. That is a long way from the alternative export capacity implied by its infrastructure specifications.
IEA+1
The UAE's Fujairah route was not immune to the war either. Reuters reported that drone attacks affected oil loadings at the terminal, undermining the assumption that a route outside Hormuz was automatically a secure route.
Reuters
There was also a wider geographical problem. Saudi oil reaching Yanbu on the Red Sea still had to travel through the Bab el-Mandeb to reach many Asian buyers, exposing shipments to the Houthi threat that Wendover discusses when describing Iraq's alternative route.
The subsequent record was particularly revealing: Saudi and UAE bypass exports rose from 4.1 million barrels daily in February to 7.8 million in June, but fell to 5.5 million in August after Houthi attacks disrupted Red Sea shipping. An attack on Saudi Arabia's East–West Pipeline then forced its shutdown in early September.
IEA
The pipelines mattered enormously. But they were neither unlimited nor invulnerable.
The market survived by spending its reserves and reducing consumption
Here is the strongest defence of Wendover's central argument: the global oil market did have buffers, and the missing Gulf exports did not translate into an equivalent immediate shortage everywhere.
The IEA subsequently explained that global markets entered the crisis with substantial excess supply. Production exceeded demand by an average of 1.4 million barrels daily during 2025, with the surplus exceeding 2 million barrels daily in the second half of the year. This created inventories that could be drawn down when Gulf exports collapsed.
IEA
That is an important discovery. It helps explain why the global market balance was much less severe than the headline export losses.
But the buffers had to be consumed.
By April, the IEA reported that global oil inventories had fallen by 85 million barrels during March. Stocks outside the Middle East Gulf had declined by 205 million barrels, while floating storage inside the Gulf increased by 100 million barrels and onshore crude stocks there rose by another 20 million.
IEA
In June, the IEA identified three additional sources of relief: emergency stock releases, increased production from suppliers outside the Gulf, and rapid adjustments by refineries to compensate for missing crude and refined products. Global inventories had been falling by an average of 3.8 million barrels daily since the conflict began.
IEA
By September, the scale of that adjustment was even clearer:
- Global oil demand over the preceding six months averaged 5.8 million barrels daily below February levels.
- The cumulative reduction in demand exceeded 1 billion barrels.
- Global observed oil inventories were 507 million barrels below their prewar level.
- IEA member countries had released more than 300 million barrels from emergency reserves.
- Producers outside the Gulf had added approximately 420 million barrels of supply since the conflict began.
IEA
Demand reduction was not simply consumers deciding to buy electric vehicles. It included reduced Chinese oil imports, lower refinery activity, restricted petrochemical operations, aviation cuts, fuel rationing and emergency conservation measures.
That is the cost hidden by a reassuring production statistic.
The market did not replace every missing barrel through clever infrastructure. It used stored oil, emergency reserves, additional production elsewhere and reduced consumption. Those adjustments prevented a much worse immediate outcome, but they also depleted the resources available to withstand another disruption.
The elasticity calculation is not an elasticity estimate
Wendover's explanation of oil demand is broadly reasonable. Oil is difficult to replace immediately, and consumers cannot simply stop driving, transporting goods or operating essential industries when prices rise.
But the calculation used to support the argument is methodologically defective.
Price elasticity of demand measures the percentage change in quantity demanded divided by the percentage change in price. Wendover instead divides an estimated 8% reduction in production by a 60% price increase and presents the resulting −0.13 as the market's implied demand elasticity.
A reduction in production is not the same as a reduction in consumption. Missing production can be compensated for by drawing inventories, releasing emergency reserves, increasing output elsewhere or reducing refinery activity. Those adjustments must be accounted for before the actual change in consumption can be established.
There is also a problem with the 60% figure. The video does not identify its precise benchmark or comparison dates. The US Energy Information Administration's Brent spot-price series records $71.32 per barrel on February 27 and $126.69 on March 31, an increase of approximately 77.6%. Different comparison periods produce different results, making the video's calculation impossible to reproduce confidently.
U.S. Energy Information Administration
The −0.1 elasticity estimate may be a reasonable approximation for short-term oil demand. But the video's −0.13 calculation does not independently establish it. It uses a supply-side change as a substitute for measuring actual consumer demand.
That is not economic analysis of the precision the presentation implies.
Commodity traders become an explanation without sufficient evidence
The narrator gives commodity traders considerable responsibility for amplifying the oil-price increase.
The proposed mechanism is plausible: traders anticipate shortages, buy physical oil, store it and use financial instruments to position themselves for higher prices. Those actions can influence immediate market conditions.
But the video moves from describing a possible mechanism to presenting it as a major explanation without providing evidence of what traders actually did during this particular crisis.
Where are the March 2026 trading positions? How much oil was purchased for speculative storage? Which inventory changes can be attributed to financial traders rather than refiners securing replacement cargoes?
The distinction matters because academic research has repeatedly challenged the assumption that financial speculation is a major independent driver of oil prices. A review by Lutz Kilian, Bassam Fattouh and Lavan Mahadeva, published through the Centre for Economic Policy Research, found that the available evidence did not support an important role for speculation in driving spot oil prices after 2003. That research does not settle what happened in 2026, but it makes event-specific evidence essential.
CEPR
The IEA's contemporary account offers a more concrete explanation: physical crude benchmarks and price differentials surged ahead of futures markets as refiners scrambled to replace Middle Eastern cargoes. That is direct evidence of physical scarcity and competition for available oil.
IEA
Traders may have amplified the movement. The video does not establish how much they contributed.
Insurance was a bottleneck, not the entire blockade
Wendover's discussion of marine insurance identifies a genuine and important part of the crisis. However, it compresses several different insurance arrangements into a simpler story of insurers withdrawing coverage and making shipping functionally impossible.
The distinction matters.
All 12 members of the International Group of P&I Clubs issued 72-hour cancellation notices affecting certain war-risk coverage. But the cancellations concerned specific non-poolable war risks; ordinary mutual P&I coverage remained unaffected, and insurers indicated that war coverage could be reinstated on revised terms.
S&P Global
Premiums genuinely became extraordinary. S&P Global reported that additional war-risk premiums reached approximately 2.5% of vessel value earlier in March, before easing to around 1% by March 27. Some stranded tankers reportedly faced premiums as high as 10%.
S&P Global
But insurance was not the only reason ships remained outside the strait.
An insurance underwriter told S&P Global that coverage was available and identified crew safety as the reason vessels were not transiting. Shipowners were unwilling to expose their crews to missile and drone attacks, even when insurance could be obtained.
That distinction changes the explanation. Insurance cancellations and extraordinary premiums helped discourage shipping, but physical danger and the decisions of shipowners were equally important.
The video is right to include insurance. It is wrong to let the insurance story become a substitute for the wider operational reality.
The real story is how the world paid to survive
Wendover's central insight deserves a more rigorous conclusion.
The world did not lose every barrel that normally passed through Hormuz from its total consumption. The global market had accumulated surplus supply, alternative routes existed, emergency inventories were available, and producers outside the Gulf could increase output.
The IEA's September assessment confirms that these adjustments substantially reduced the market imbalance. Despite Hormuz flows remaining 13.1 million barrels daily below prewar levels in August, the estimated global supply-demand deficit was 2.2 million barrels daily in the second quarter and 1.7 million in the third.
IEA
But look at what was required.
The market entered the crisis with a surplus. It subsequently consumed that surplus, redirected oil through alternative infrastructure, increased production elsewhere, released emergency reserves and forced consumers to reduce consumption.
By September, global inventories had fallen 507 million barrels below their prewar level. More than 300 million barrels had been released from IEA member countries' emergency stocks, while global demand had averaged 5.8 million barrels daily below February levels over the preceding six months.
IEA
These are not signs that the disruption was insignificant. They are evidence of how much adjustment was required to prevent an even worse outcome.
Consider the difference between two statements:
- The global oil market avoided losing the full volume normally transported through Hormuz.
- The global oil market absorbed the consequences of losing that volume without serious economic damage.
The first is supported. The second is not.
The market's ability to keep functioning depended on spending reserves, finding replacement suppliers and reducing consumption. Those measures have costs, and some of those costs remain even when the immediate shortage becomes less visible.
The verdict
Wendover has produced an informative explanation of oil-market mechanics, but its central argument is too reassuring for the evidence it presents.
The 8% figure was already outdated when the video appeared. Its four alternative pipelines were not four equivalent, fully operational export routes. Its elasticity calculation substitutes lost production for reduced consumption. Its account of commodity speculation lacks evidence establishing the traders' actual contribution.
Most importantly, it mistakes the market's ability to absorb a shock for evidence that the shock was relatively small.
The world did not escape the Hormuz crisis through clever pipelines and clever traders alone. It relied on years of accumulated inventories, emergency government intervention, additional production outside the Gulf and enormous reductions in consumption.
The oil did not magically find its way to buyers. The world spent its reserves and made do with less.
That is a very different story from saying the shutdown was not quite as bad as people thought.
References
1. Wendover Productions — How the Iran War Spiked Oil Prices, April 17, 2026. Original video — The original argument, pipeline analysis, price calculations and insurance explanation examined in this article.
2. International Energy Agency — Oil Market Report, March 2026, March 12, 2026. Read the report — Establishes that the widely quoted 8-million-barrel supply reduction was an early forecast and documents the initial emergency stock-release decision.
3. International Energy Agency — Oil Market Report, April 2026, April 14, 2026. Read the report — Provides the revised 10.1-million-barrel production-supply reduction, export losses, inventory movements and market disruption figures.
4. International Energy Agency — Strait of Hormuz Factsheet, February 2026. Read the factsheet — Establishes the distinction between crude and refined-product shipments, available bypass capacity, and the operational limitations of Iran's Jask terminal.
5. Reuters — Alternative Routes for Middle East Oil and Gas Due to Hormuz Disruption, April 21, 2026. Read the report — Documents the actual restart of Iraqi exports, their initial volumes, Saudi export constraints and the security risks facing alternative shipping routes.
6. S&P Global — Aramco's East-West Pipeline to Hit Full Capacity in Next Couple of Days: CEO, March 10, 2026. Read the report — Shows that Saudi Arabia reached for overseas inventories as well as maximum pipeline capacity to satisfy customers.
7. S&P Global — Iran Turns to Crude Exports via Jask Terminal Amid Hormuz Disruptions, August 5, 2026. Read the report — Uses satellite imagery and shipping data to establish the limited actual export volumes passing through Jask.
8. International Energy Agency — How Global Oil Supplies Have Readjusted to Help Fill the Huge Gap Left by the Strait of Hormuz Shock, June 22, 2026. Read the analysis — Identifies emergency stock releases, non-Gulf production, refinery adjustments and inventory drawdowns as major mechanisms that cushioned the disruption.
9. International Energy Agency — Oil Markets Strain to Plug the Gap Left by Middle East Supply Shortfall, September 18, 2026. Read the analysis — Provides the longer-term evidence of export losses, demand destruction, bypass-route performance and depleted global inventories.
10. S&P Global — Marine War Insurance Reporting, March 2026. Coverage cancellation report and Insurance premium report — Distinguishes the cancellation of specific war-risk coverage from the complete withdrawal of marine insurance and documents actual premiums and shipping constraints.
11. Kilian, Fattouh and Mahadeva — The Role of Speculation in Oil Markets: What Have We Learned So Far?, Centre for Economic Policy Research, March 2012; revised May 2019. Read the research paper — Reviews empirical evidence on speculation and challenges the assumption that financial traders are major independent drivers of spot oil prices.
12. US Energy Information Administration — Europe Brent Spot Price FOB, Daily Price Series. View the price data — Provides the underlying daily Brent prices needed to reproduce and assess the video's claimed 60% increase.