La Paz's Cable Cars Are a Transport Success. Their Financial Story Is Less Comfortable.
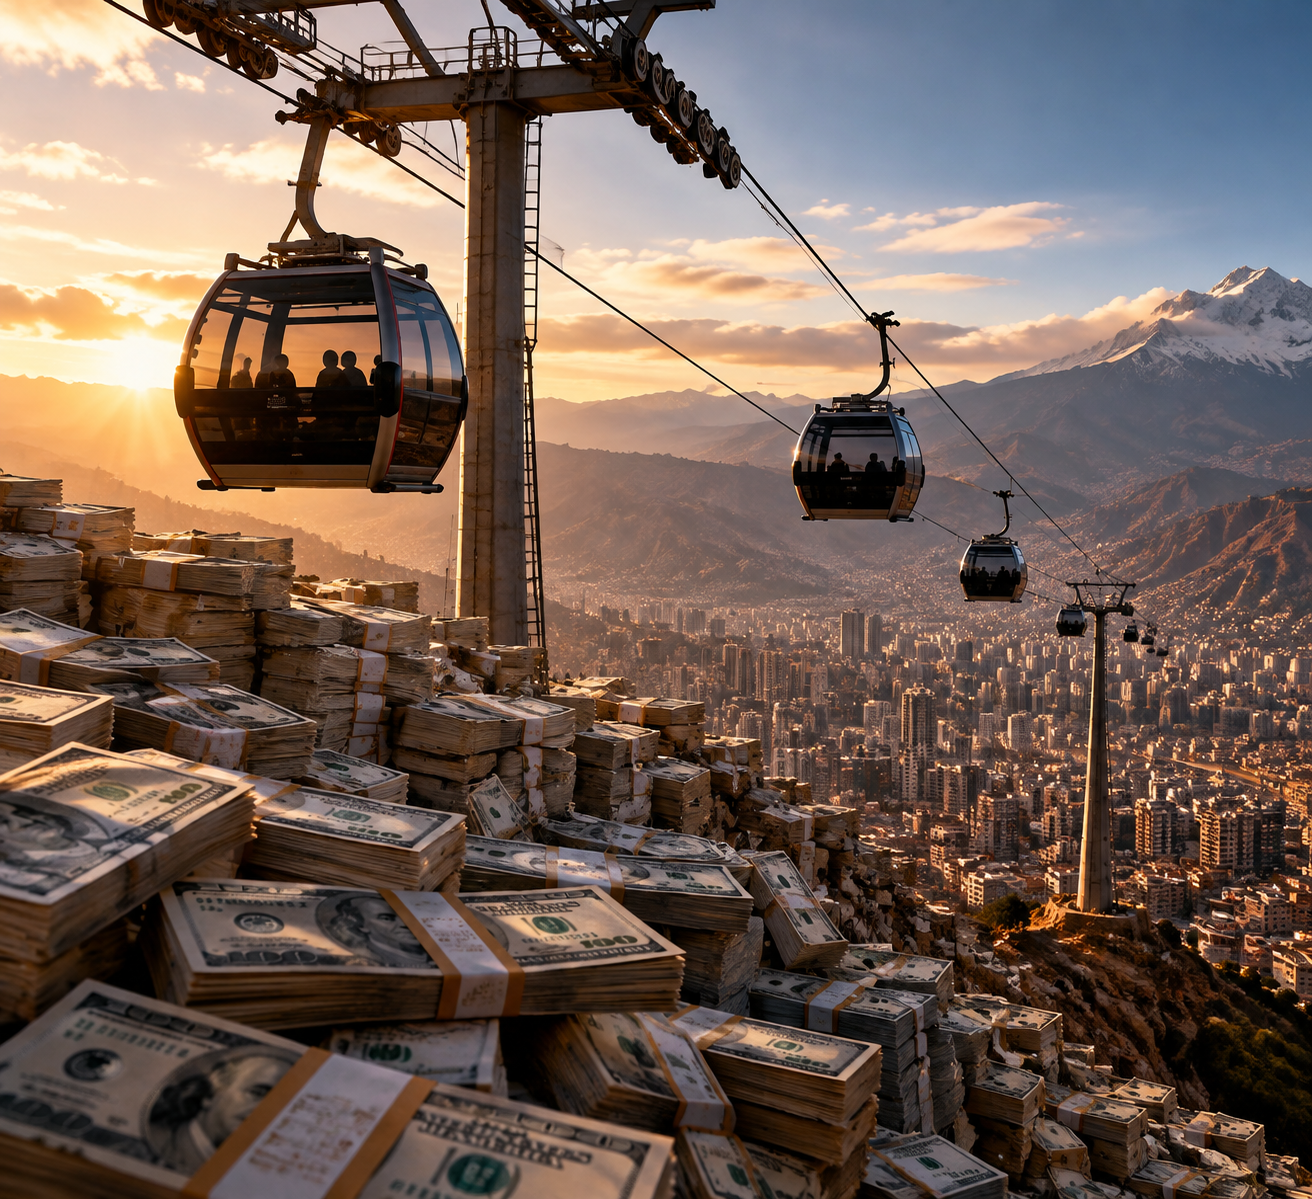
Mi Teleférico has achieved something genuinely difficult: it connects two geographically divided cities, moves hundreds of thousands of passengers, and gives working-class residents access to opportunities that road transport made unnecessarily difficult to reach. But there is a substantial difference between a transport system that pays its electricity bills and one that pays for itself.
Wendover Productions makes the distinction too easy to overlook. Its central financial argument rests on inexpensive construction, strong ridership and the claim that the system operates without government subsidies. The first two deserve serious credit. The third is true only within a narrow definition of operating costs, and it leaves out a much larger question: who paid for the infrastructure, what it costs to replace, and whether its economics justify the investment?
Bolivia's own financial records make that question considerably harder to dismiss. By 2025, Mi Teleférico had accumulated approximately Bs 2.192 billion in accounting losses across twelve consecutive loss-making financial years. Yet the company says its ticket and commercial revenues cover its cash operating expenses without transfers from the Treasury. Both statements can be true. Understanding why requires looking beyond the reassuring word self-sustaining.
El Post+2
The headline benefit-cost ratio leaves out the construction bill
Wendover cites a benefit-cost ratio of 1.05 to 2.16 from research by Sebastian Martinez, Raul Sanchez and Patricia Yáñez-Pagans. The research was published as an Inter-American Development Bank working paper in 2018 and subsequently appeared in the peer-reviewed journal Economía in 2024.
There is a crucial qualification in the original research. Its authors explicitly state that their cost calculations include the costs of providing the service and debt service, but exclude the project's investment costs. In other words, the celebrated ratio does not establish that the economic benefits outweigh the full cost of building the infrastructure.
EconStor+2
The distinction is substantial. The study used a 2016 household survey covering 3,575 households and evaluated the first three cable-car lines, not the completed ten-line network. Its estimates are local average treatment effects: they measure outcomes for people whose use of the system was influenced by living near a station, rather than establishing the average effect across the entire metropolitan population.
EconStor+1
The headline ratio also depends heavily on assumptions about the value of time.
The researchers' baseline scenario assumes two trips per day and values saved commuting time using average household income. Under that calculation, benefits reach approximately 2.16 times service costs. But changing the assumptions produces a less impressive result:
- Four daily trips reduce the ratio to between 0.99 and 1.08.
- Using minimum-wage income produces ratios around break-even, including 0.96 in one model.
- Assuming lower travel-time savings also produces ratios below one.
- The researchers' worst-case scenario produces ratios between 0.43 and 0.52.
These are the study's own sensitivity calculations, not objections invented by a critic. Wendover presents the 1.05–2.16 range without explaining that the underlying research also produces scenarios in which estimated benefits fall below costs.
EconStor+1
There is another important qualification. The 70-minute daily time-saving estimate used in the benefit-cost calculation is an estimate for a particular group of commuters, not necessarily the average rider. The researchers acknowledge that the time-use data are noisy, give a wide confidence interval of 34.6–106 minutes, and note that their ordinary regression estimate of 12 minutes may be closer to the average effect.
A ratio built on an unusually large estimated time saving should not be presented as though it were a settled return for the entire population.
EconStor+1
The 58-cent benefit was not established for the poorest passengers
Wendover also cites research estimating that cable-car passengers save approximately 22% of their commuting time, equivalent to nine minutes per journey and a net economic benefit of US$0.58 per trip.
That finding comes from a separate 2015 Inter-American Development Bank survey. Its researchers examined 12,066 journeys reported by 6,720 people across La Paz and El Alto. The headline result is legitimate, but the authors included a qualification that materially changes its social interpretation.
IADB Publications+1
Only 9% of the cable-car users in the study's treatment sample earned less than 1,600 bolivianos per month. The researchers explicitly warned that their estimated US$0.58 benefit might not apply to the poorest passengers.
Their reasoning was straightforward: someone earning very little may value saving nine minutes less than keeping the additional money required to purchase a more expensive ticket. Such passengers may rationally choose a slower, cheaper minibus instead.
The same survey found that cable cars represented just 2% of reported journeys, compared with 57% for minibuses. These are 2015 figures, from the early three-line network, not current modal shares. Nevertheless, they expose a weakness in using the average passenger benefit as evidence that the poorest residents necessarily benefit most.
IADB Publications+2
This does not invalidate the network's social achievements. It means that faster transport and affordable transport are not automatically the same thing. A system can dramatically improve mobility for its users while remaining financially unattractive to some of the people it was designed to help.
The full network cost approximately $740 million
The video's $235 million construction figure is accurate for the original three-line phase. But the ten-line network required considerably more investment.
In July 2017, Mi Teleférico's then-manager César Dockweiler reported that the first two phases, covering ten lines, required more than $740 million.
The first phase cost approximately $234.6 million. The second phase was initially budgeted at $450 million and subsequently expanded to $506 million.
La Razón+2
This is not evidence that the project was wasteful. It is the actual scale of the infrastructure investment against which its economic benefits should be evaluated.
And the financing matters. The Global Infrastructure Hub's project assessment states that the Bolivian central government was solely responsible for the initial capital investment, with the National Treasury providing 100% of Phase I financing. The government also financed Phase II.
The distinction is important: a transport company can cover its day-to-day operating expenses while the public sector remains responsible for the enormous capital investment that made the service possible.
content.gihub.org+1
The public financing has not disappeared with the original construction. In September 2026, Bolivia authorized a further $62 million IDB loan to expand the network and modernize its infrastructure. The loan carries a 21.5-year repayment term, an eight-year grace period and a sovereign guarantee.
The programme includes extending the Brown Line, installing solar generation and improving connections to El Alto airport. It is an investment loan, not an operating subsidy, but it demonstrates that expansion continues to depend on public-backed financing.
Inter-American Development Bank+2
The central question is therefore not whether the first three lines were inexpensive to build. It is whether the entire capital investment, subsequent expansions, maintenance and eventual replacement costs produce sufficient economic benefits over the system's useful life.
The cited benefit-cost ratio does not answer that question.
The system's financial independence is real, but incomplete
There is an important point in Wendover's favour: Mi Teleférico genuinely has evidence of operational self-sufficiency.
A 2019 Global Infrastructure Hub case study reported that the company did not require government subsidies for operations and maintenance. It recorded an operating surplus of approximately US$5.8 million in 2018.
content.gihub.org+1
But its revenue model is more sophisticated than the video suggests.
In 2017, the company reported approximately US$17 million in fare collection and US$19 million in ancillary revenue. The latter came from commercial activities including advertising, parking and rental of commercial spaces.
These activities are legitimate business revenues, not government subsidies. But they matter when assessing how the system actually finances its operations.
content.gihub.org
More recent financial reporting reinforces the distinction.
In September 2026, company manager Christian Eduardo Rojas said Mi Teleférico had generated an operating cash surplus of approximately Bs 10 million in its latest financial year without receiving direct operating transfers from the Treasury.
The same financial records show substantial accounting losses, however. El Post's examination of government enterprise data found accumulated losses of approximately Bs 2.192 billion between 2014 and 2025, across twelve consecutive loss-making years.
The company attributes most of the accounting deficit to depreciation, estimated at approximately Bs 200 million annually. Depreciation is not money immediately leaving the company's bank account, so those accounting losses must not be confused with annual cash subsidies. The 2025 financial statements in the dataset were also unaudited.
unitel.bo+2
El Post additionally estimates that the state contributed approximately Bs 5.9 billion in capital to the infrastructure.
The correct conclusion is neither that Mi Teleférico is secretly consuming billions in annual operating subsidies nor that the entire investment has paid for itself. It is a publicly financed infrastructure asset that has demonstrated an ability to cover its cash operating expenses.
Those are three different financial questions. Wendover does not adequately connect them.
The economics depend on geography and passenger demand
There is a reason the La Paz example works so well: its geography creates a problem that conventional transport struggles to solve.
But this is precisely why the economics cannot be generalized.
A March 2026 paper by Sergio Jara-Díaz and Esteban Muñoz-Paulsen, published in Research in Transportation Economics, develops a comparison between cable cars and buses that includes infrastructure costs, operating costs, passenger travel time, slope and crowding.
Its conclusion is conditional: cable cars offer advantages on moderate-to-steep slopes and at medium demand levels, but those advantages disappear when capacity is exhausted.
ScienceDirect+1
This is a more useful decision rule than simply comparing construction costs per kilometre.
A cable car can be an excellent investment where buses must navigate extremely long, steep routes and trains would require prohibitively expensive infrastructure. On flatter routes or corridors with very high passenger demand, conventional transport can be superior.
The World Bank's 2020 review of 21 aerial cable-car projects also noted that reliable operating and maintenance cost data were relatively limited across the sector. That makes confident claims about long-term financial superiority particularly difficult without detailed, comparable lifecycle accounts.
PPP Resource Center+1
Wendover recognizes several of these limitations, particularly fixed capacity and mechanical reliability. The problem is that its financial evidence does not receive the same level of scrutiny.
Verdict: A successful transport system is not automatically a successful financial investment
Mi Teleférico deserves recognition for connecting La Paz and El Alto, reducing journey times and providing mobility to people who previously faced difficult journeys across steep terrain.
Its operating independence is also a genuine achievement. There is no reason to dismiss the system simply because the government financed its construction. Public infrastructure is supposed to create public benefits.
But the video's strongest economic argument is incomplete.
The celebrated 1.05–2.16 benefit-cost ratio excludes project investment costs. Its underlying estimates apply to specific groups of passengers, rely on assumptions that can reduce the ratio below one, and do not establish the return on the completed ten-line network. The US$0.58 passenger benefit also carries an explicit warning about its applicability to the poorest commuters.
La Paz demonstrates that gondolas can transform urban mobility. It does not establish that the full system's capital costs are outweighed by its benefits, or that other cities should expect the same financial results.
That distinction matters. Governments deciding how to spend hundreds of millions of dollars need more than a compelling story about faster commutes and inexpensive construction. They need an honest accounting of the entire investment, who benefits, who pays and what happens when the infrastructure grows old.
A successful cable car is an argument for building the right cable car in the right place. It is not a blank cheque for the next one.
References
1. The Surprising Success of Gondola Transit Systems — Wendover Productions, YouTube. Original video. The work examined in this critique.
2. Getting a Lift: The Impact of Aerial Cable Cars in La Paz, Bolivia — Sebastian Martinez, Raul Sanchez and Patricia Yáñez-Pagans, Inter-American Development Bank, December 2018; subsequently published in Economía, Vol. 23, No. 1, 2024. Full working paper · Peer-reviewed journal version. Establishes the household-level research, benefit-cost methodology, sensitivity tests and explicit exclusion of project investment costs.
3. ¿Los teleféricos como alternativa de transporte urbano? Ahorros de tiempo en el sistema de teleférico urbano más grande del mundo: La Paz-El Alto — Ancor Suárez-Alemán and Tomás Serebrisky, Inter-American Development Bank, 2017. Original research. Establishes the 22% time-saving estimate and the researchers' warning that the US$0.58 benefit may not apply to the poorest passengers.
4. Inversiones para decena de líneas de teleféricos en La Paz superan los $us 700 millones — La Razón, reporting from Agencia Boliviana de Información, July 6, 2017. Article. Documents the approximately US$740 million investment reported by the company's manager for the ten-line network.
5. Mi Teleférico Cable Car, Bolivia — Global Infrastructure Hub, Inclusive Infrastructure and Social Equity, 2019. Case study. Documents government capital financing, operating surplus, fare revenue and ancillary commercial income.
6. ¿Mi Teleférico recibe subsidio? Lo que dicen sus balances — El Post, September 16, 2026. Financial investigation. Examines official public-enterprise financial data and distinguishes operating cash surpluses, depreciation, accumulated losses and state capital contributions.
7. Program for the Expansion of the Mi Teleférico Network for Sustainable and Inclusive Electric Mobility for La Paz — Inter-American Development Bank, approved October 18, 2023. Project record. Establishes the US$62 million sovereign-guaranteed financing, repayment terms and planned expansion.
8. By Air or Land? Comparing Costs of Cable Car and Bus Systems Design — Sergio Jara-Díaz and Esteban Muñoz-Paulsen, Research in Transportation Economics, Volume 116, March 2026. Research paper. Provides a comparative model showing how slope, crowding, passenger demand and user costs determine when cable cars outperform buses.
9. Urban Aerial Cable Cars as Mass Transit Systems: Case Studies, Technical Specifications, and Business Models — World Bank Group, September 2020. Full report. Documents international system characteristics and highlights the limited availability of comparable operating and maintenance cost data.